[Updated Friday, April 11, 2014]
Our open research collaboration has tested the abilities of10 12 current force fields to correctly sample the headgroup and glycerol conformations in phospholipids. The C-H order parameters calculated from simulations were compared to the corresponding ones measured in accurate NMR experiments. We found that none of the force fields is perfect, but promising results were obtained with the CHARMM36 and the unpublished Maciejewski–Rog force fields.
Our open research collaboration has tested the abilities of
 |
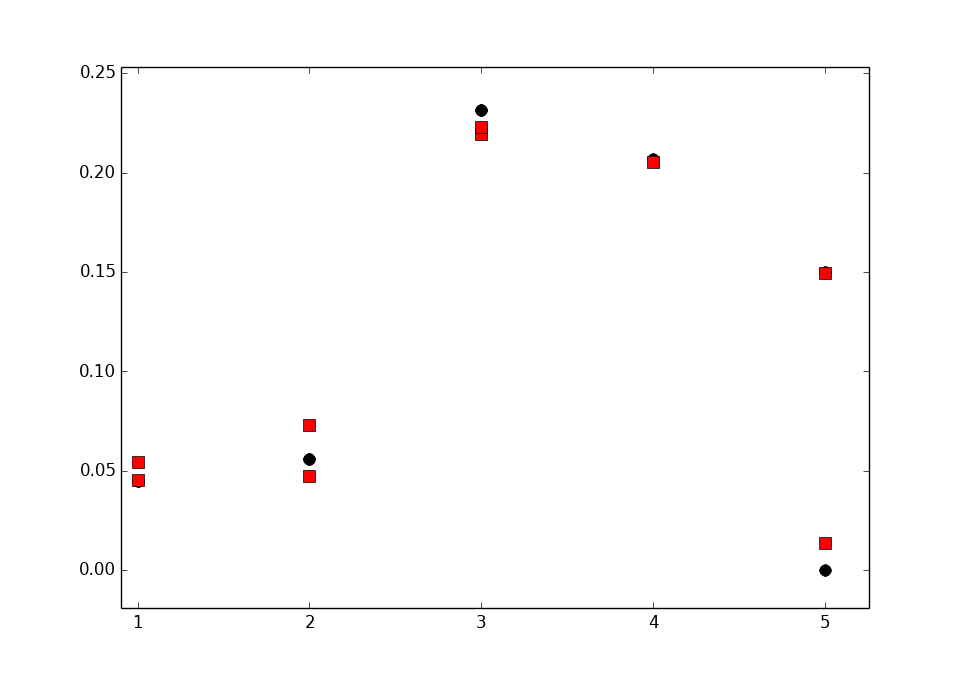
| Figure 1. The Lipid forcefield comparison. The absolute values of PC-lipid headgroup and glycerol C-H order parameters compared to values measured in NMR experiments. Pure systems, full hydration. The following The computational values have been posted to the nmrlipids.blogspot.fi-blog by the project participants, except for the GAFFlipid and one of the CHARMM36 data sets, which were taken from the original publications [Dickson 2012, Klauda 2010]. The experimental values were taken from the following publications: DMPC 303K from Gross 1997, DMPC 314K from Dvinskikh 2005, DPPC 310K from Gally 1981, DPPC 322K from Seelig 1977, DPPC 323K from Akutsu 1981, and POPC 298K from Ferreira 2013. The vertical bars shown for some of the computational values are not error bars, but demonstrate that for these systems we had two data sets; the ends of the bars mark the values from the two sets, and the dot marks their measurement-time-weighted average. |
Our results are summarised in Fig. 1; in the following we discuss the key points.
Experimental data fall close to one another, irrespective of the lipid tails, temperature, salt (NaCl) concentration, or the experimental technique used. This excellent repeatability has already been discussed at length in Samuli's post on accuracy. Motivated by the high experimental repeatability, we have highlighted in Fig. 1 subjective sweet spots (light blue areas), within which we expect the calculated order parameters of a well-performing force field to fall.
Forking of the order parameters was observed in some cases. (Note that to avoid confusion with the established NMR term splitting—used e.g. to refer to the dipolar splitting in NMR spectra—we use here the word forking to describe the situation where the order parameters of different hydrogens in a single carbon are not equal.)
If the corresponding experimental value is not forked (as is the case for the \(\alpha\)- and \(\beta\)-carbons), forking in the calculated value signals that the simulation is sampling an unrealistic conformation, for which the C-H bond distributions for the hydrogens disagree; this must be considered as a serious shortcoming of the force field. Note, however, that for the g3- and g1-carbons the experimental values do fork (although the forking of the g3 carbon is small and some experiments only report the larger or the average value).
If the corresponding experimental value is not forked (as is the case for the \(\alpha\)- and \(\beta\)-carbons), forking in the calculated value signals that the simulation is sampling an unrealistic conformation, for which the C-H bond distributions for the hydrogens disagree; this must be considered as a serious shortcoming of the force field. Note, however, that for the g3- and g1-carbons the experimental values do fork (although the forking of the g3 carbon is small and some experiments only report the larger or the average value).
None of the forcefields was perfect—three all-atom force fields, however, came close (Fig. 2 focuses on just these three to help comparison):
1) CHARMM36 was the only force field that clearly had no forking in the \(\alpha\)- and \(\beta\)-carbons, but it suffered from slightly too ordered \(\beta\)-, g3- and g1-carbons.
2) Maciejewski–Rog had almost all the values within the sweet spots, but suffered from forking in \(\beta\) (and possibly in \(\alpha\)) as well as a too wide split in g3.
3) GAFFlipid appears generally promising. It suffers, however, from slight forking in \(\alpha\) and \(\beta\), and from too ordered g2 and g1. In addition, we have not been able to reproduce these order parameters so far (see the note on technical issues in the end of this post), and thus show here only the originally reported values [Dickson 2012].
 |
| Figure 2. The same data as in Fig. 1, but only for the three best-performing force fields. |
We note that also the all-atom HoNiLy force field performed quite well in our test, although it did suffer from forking in the \(\alpha\)-carbon, too ordered \(\alpha\)- and g3-carbons, and a too wide forking in g3 (Fig. 1). However, because HoNiLy is a modified CHARMM force field and, in fact, an early development version of the Slipids force field, it appears not urgent to study its further properties.
We also note that by far the best order parameters for the fully hydrated case were reported on March 9th 2014 by Antti Lamberg, who used simple brute force heuristics to optimise the dihedral parameters (of a united atom force field) to accurately reproduce the experimental values. As this approach is very fresh, and currently under discussion, we have not yet included these results into the comparison.
Conclusion: Next we need the responses. There clearly is still room for improvement in the current force fields, even in the standard system of a pure lipid bilayer at full hydration. However, the quality of a force field (in terms of the goal we set for this project, that is, correctly reproducing the headgroup conformations) depends ultimately on its ability to correctly respond to changing environmental conditions.
Based on the here presented analysis at full hydration, it is now justified to focus mostly on testing the responses—to hydration levels, ion concentrations, and cholesterol content—in the top three force fields: CHARMM36, MacRog, and GAFFlipid. (In fact, some response data have already been reported in the blog. An overview of these will be presented in a separate post.) The responses of the other
Should any of the three promising all-atom force fields pass the response tests, we might try to use it as a basis on which to build a well-performing united atom model. If successful, this approach would fulfil the goal of our project.
Things still To Do for full hydration:
Calculate the order parameters in the new AmberLipid14: Work already in progress by Samuli.Calculate the order parameters in the Ulmschneider force field: No work yet in progress.- Calculate the order parameters in the CHARMM36-UA force field: No work yet in progress.
Notes on some technical issues that came up while the results presented here were produced. These notes are probably not crucial for the goals of the nmrlipids-project, but are presented here as they might be of general interest to the project participants or to the lipid simulation community at large.
We were not able to completely reproduce the results for GAFFlipids (area per molecule, order parameters) reported in the original publication [Dickson 2012]. We tested various approaches (different lipid types, different bond constraints, different thermostats, different hydrogen masses), but the issue remains so far unsolved. It is possibly related to differences between Gromacs and Amber simulation packages.
Three problems were encountered while reproducing the results of Poger et al. 2012:
- We could not reproduce the area per molecule reported in the publication.
- Contrary to what was reported in the publication, results (area per molecule and order parameters) were affected by the choice of method for calculating the electrostatic interactions: reaction field vs. PME.
- The order parameters for the headgroup and glycerol carbons of different models (Poger, Kukol, Berger) reported by Poger et al (in their Table 2) differ from the results that have been obtained in the blog.
- It turned out that Gromacs versions 4.0 and 4.5 give different results for reaction field simulations. For more details see the Redmine Bug Report.
- While changing from reaction field to PME, Poger et al. also decreased their Lennard-Jones cut-off from 1.4 nm to 1.0 nm. This could possibly compensate for the changes we observed when switching from reaction field to PME and keeping the rest of our parameters fixed.
- This was not investigated further, as none of the reported order parameter sets (neither in the blog nor in the publication) were in good agreement with the experimental values. However, it is not clear to us if the Gromacs tool g_order was maybe used by Poger et al. for calculating the headgroup order parameters—this can be problematic should the hydrogens of a single carbon experience a split, i.e., give different order parameters.