Followed by the discussion in the latest post about quality evaluation, I plotted the form factors and order parameters as a function of the simulation box size from a dataset where box size was systematically varied with different amounts of cholesterol. The results shown in Fig. 1 reveal that the order parameters and the form factor zero-points do not depend on the simulation box size; however, the lobe heights in form factors decrease with increasing simulation box size.
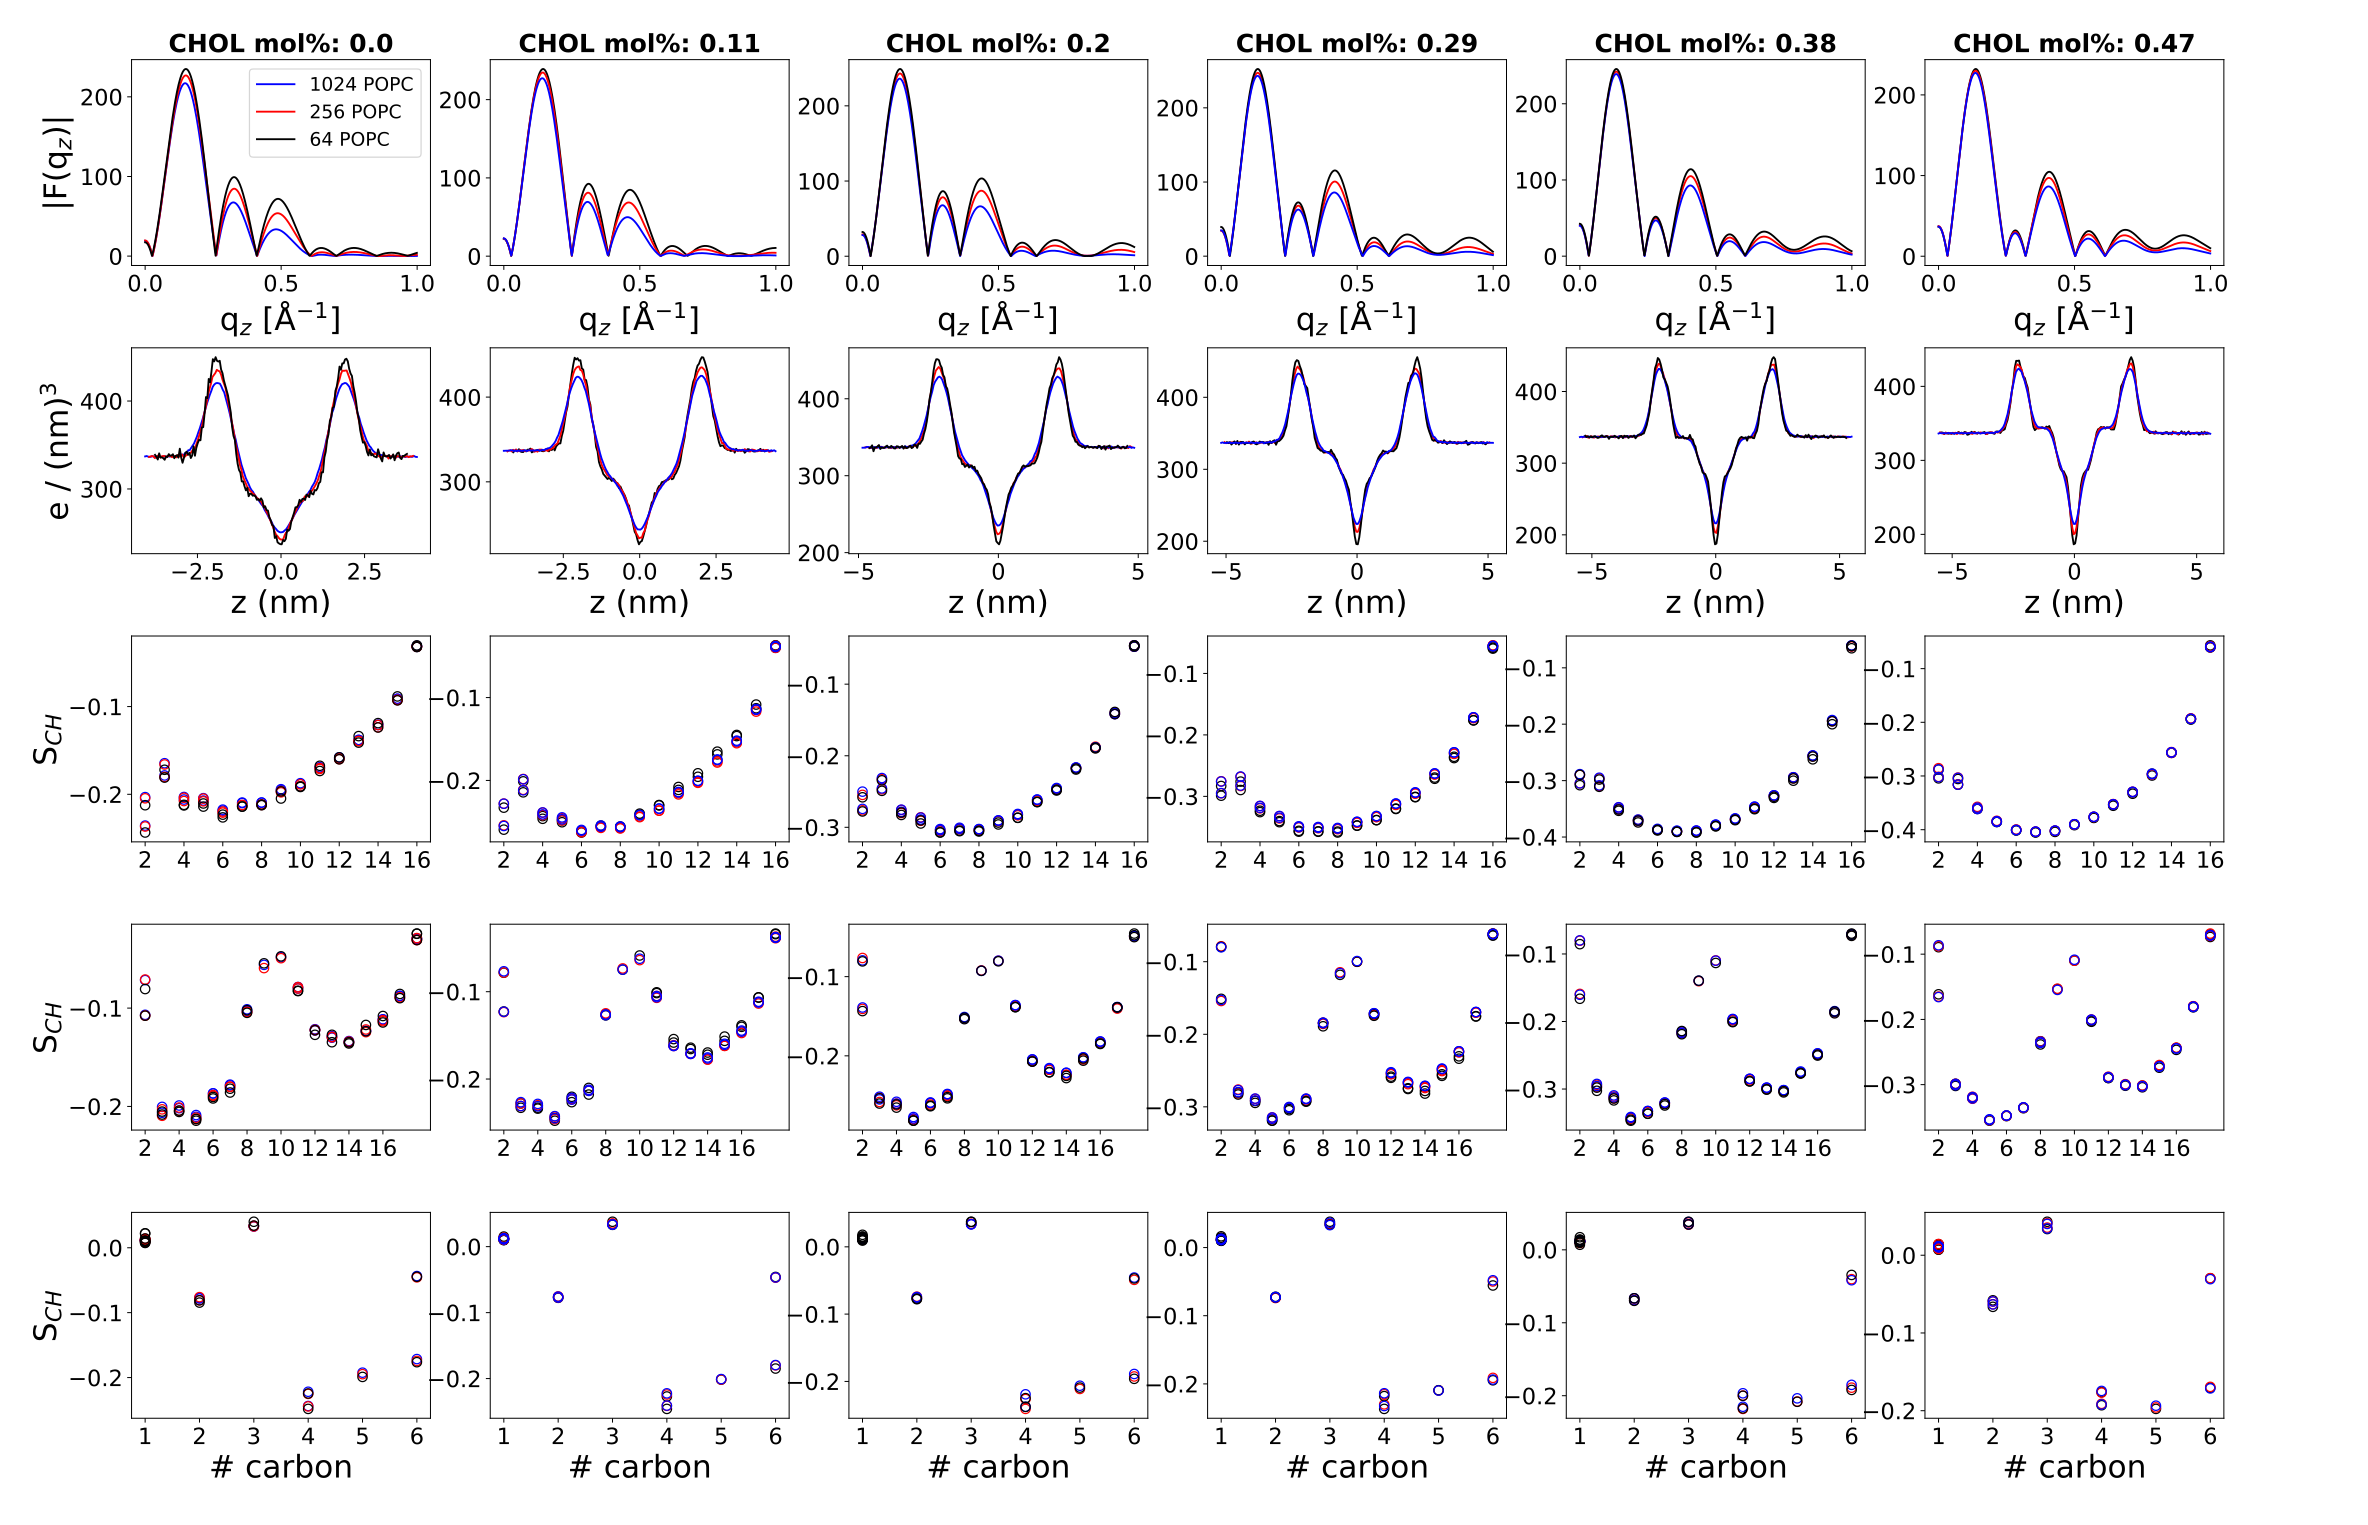 |
| Fig 1: Form factors and order parameters from simulations with different number of lipids and cholesterol concentrations. Simulation data from https://doi.org/10.5281/zenodo.5767450. Figure also available in here. |
This means that if the quality of form factors is defined as in the latest post, i.e. using the equation from the SIMtoEXP program, it will depend on the simulation box size. Therefore, I have updated the form factor quality measure in the NMRlipids Databank to be 'the distance between the first minimum in the simulated and experimental form factors'. The 'first minimum' refers here to the first minimum found in the experimental data, which has always a q-value above 0.1Å-1.
The first minimum is well correlated with the membrane thickness, as shown in the Fig. 2C (this figure is also updated in the manuscript about the NMRlipids Databank). The second minimum of the form factor would correlate even better with both the area per lipid and the thickness (see current Fig. S1 of the manuscript), but due to noise it is hard to detect automatically from some experimental data sets. Therefore, I have decided to use only the first minimum.
 |
| Fig 2: A) Best simulations ranked based on overall order parameter quality. B) Best simulations ranked based on the overall order parameter quality of POPE lipid. C)-E) Evaluation against experimental data exemplified for a simulation with the best overall order parameter quality (C), the best quality for POPE lipid (D), and the headgroup quality for POPE (E). F) Scatter plots and Pearson correlation coefficients for the area per lipid, thickness, and experimental observables. All correlation coefficients have p-value below 0.001. More correlations shown in here. |
Because order parameters did not depend on simulation box size in Fig. 1,
their quality evaluation is not changed.
No comments:
Post a Comment
Please sign in before writing your comment.